Estimating winning percentage - Pythagorean Formula for Winning Percentage - 3/28/2022
I am winding down on high school ratings and contemplating whether to tackle the Summer ratings again, but I am still going back over some statistics from this past season. Several people have inquired about their team's rating and I have dutifully re-examined several of these requests, not so much for their satisfaction as for mine. I am usually satisfied with the ratings, unless I find an error in a report table like I did for class two Montgomery County which was showing up with the Palmyra team rating of 91. I looked at the raw data spreadsheet and Montgomery girls were rated 116 and then I looked at the report table and it was posting Palmyra's rating! Poor Coach Joe Basinger was pulling his hair out over that 91 rating and that is tough when you keep it as short as he does. So I don't mind fixing my mistakes. Measure twice, cut once. Right?
Now some of the requests just turn ugly because I know the questioner won't like my answer after I compare them to team X, who they beat by 32 early in the season. Well, they don't tell me about the 4 and 6 point losses to that same team or the 17-14 record for their team vs. 23-6 record for team X but I see that when I do a re-calculation and the results are usually not to their satisfaction.
When I did this last comparison, I pulled in a new statistic that is unfamiliar to most basketball fans and even a lot of statisticians. The statistic is called Pythagorean Winning Percentage and it uses the points scored vs. points allowed by a team to calculate or estimate their winning percentage. I had incorporated Points scored/allowed in my VPS winning percentage predictions last fall. Unfortunately, I missed on a bunch of those winning percentage estimates and almost afraid to go back to review them. But I have promised myself I will review them and work on a better model.
The problem with Pythagorean Winning Percentage is that you have to play the games to get the points scored/allowed so your already know your winning percentage. It is like driving with the rear view mirror.... you already know where you came from, right?
But what if teams really worked on point differential? Scoring on the offensive end and getting stops on the defensive end. The more successful trips up the floor and the more successful defensive stops is what winning basketball is all about.
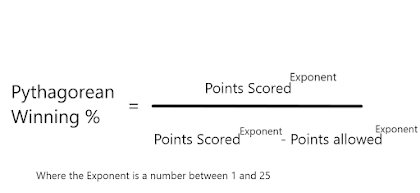
The formula looks like this:
For the NBA, statisticians have found that the exponent of 13.91 predicts NBA team winning percentages best. When I tried using the 13.91 exponent, most of my high school teams ended up with 95 to 100% winning percentages, so I worked the exponent down to about five and then came back up to an exponent of 6.4. The R-squared value for the results ends up being around 75% which means that about three-fourths of the winning percentage is explained by point differential (points scored minus points allowed).So the results for the 2021-2022 season show fairly close estimates of winning vs. the actual winning percentage. Coaches cannot emphasize enough the importance of playing defense and getting stops while being highly efficient on the offensive end. I know that the Eureka coaches put a lot of emphasis on defense and keeping opponents to 45 points or less. When they have done that, they have winning seasons.
I also looked at four highly successful teams over the time period that MSHSAA has listed records and points scored and allowed. For the past ten years or so, the Pythagorean Winning % formula does a fairly good job of predicting how these teams did in both winning and losing seasons. Here's what that analysis looked like:


Comments
Post a Comment